| SILKYPIX® | SOFTWARE MANUAL |
| 6. Easy adjustment function | ||||||||
- The warning display is a function to help adjust the parameter.
6.1 Display warning
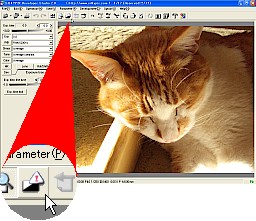 When you click the
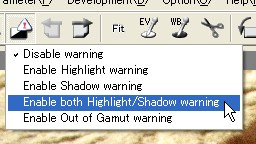
  icon on the Toolbar, you can specify each alarm.
When the preview is displayed, the alarm display will be blinking repeatedly.
The blinking in black indicates the saturated area. The blinking in white indicates the shadow parts don't have enough light exposure.
(1) Enable Highlight warning
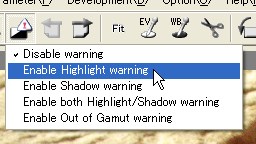 The highlighted part where the image is brighter than the specified level and the saturated color is blinking.
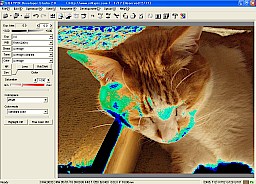 This is a convenient function to adjust the exposure bias. It is really convenient to warn you when the saturation is adjusted by reversing the colors.
Sometimes, you cannot avoid the highlight warning even if you lower the "Exposure bias level. In this case, you cannot restore the highlighted parts because the sensor is saturated. This is a way you can check whether or not the picture had too much exposure.
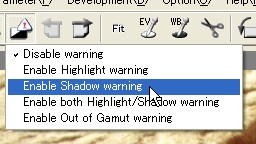 Contrary to the highlight warning, the "Shadow warning", warns you that the shadow parts do not have enough light exposure.
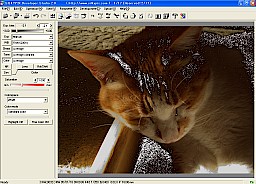
 This function will warn you at the same time about the highlights and shadow parts.
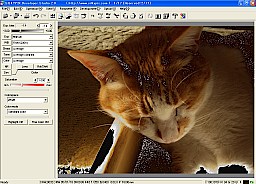
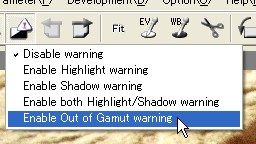 Out of gamut area is blinking.
 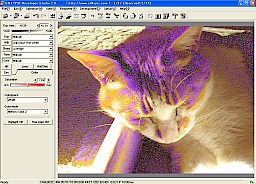 @
@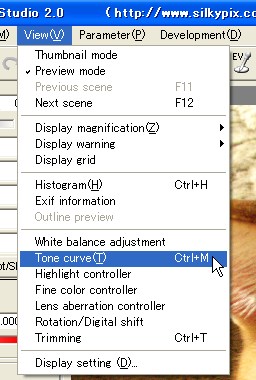 In the menu [View (V)] - [Tone curve (T)], "Tone curve" dialog will begin.
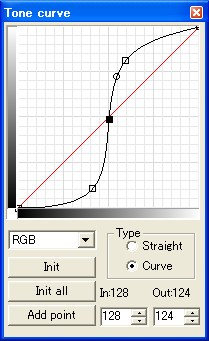 When you specify the "Tone curve", this will convert the brightness of the targeted image.
The horizontal axis is input brightness and the vertical axis is output brightness.
* The size of the dialog can be adjusted by dragging the windows frame. Moreover, the size of the dialog can be adjusted by keeping the aspect ratio of the dialog when dragging it while holding the Shift key.
6.2.1 Edit of points
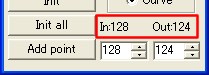 A curve is drawn to pass through the specified point, to adjust the curve by adding and moving the point. The color coordinates are displayed right-side of the all initialization button.
The guide display function: The value of the position is displayed when there is a cursor on the preview.
(1) Adding point
- Click on the point on the graph with your mouse, and then the point will be placed in the right position.
- You can move the point by dragging the mouse
- Move the cursor to the point that you want to delete, and the point will delete by clicking the right button.
Moreover, a current point can be deleted by using the Delete key. You are able to delete up to the last two points.
- The current point is displayed in red, and this is the point to work from. Use the Delete key to delete this point.
[X] button ... Close the dialog.
(1) Type ... Select the type of tone curve you want to edit.
| RGB | Edit the tone curve for all RGB element. |
| R | Edit the tone curve for only R element. |
| G | Edit the tone curve for only G element. |
| B | Edit the tone curve for only B element. |
(3) [Init all] button ... Initialize all tone curve to default.
(4) [Point cursor] ... Indicate the tone curve point of the color of mouse cursor on the preview image.
(5) [Add point] button ... Enter "Add point" mode. You can add the point on the tone curve by clicking mouse on preview image.
* (4) [Point cursor] and (5) [Add point] button are enabled only when tone curve is monotonically increasing or decreasing.
- You can select two of the following types;
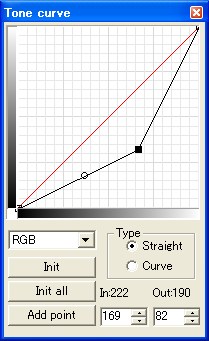 (1) Straight line - The specified points is connected with line segments
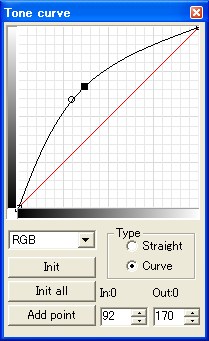 (2) Curve - The specified points are connected with the smooth curve line.
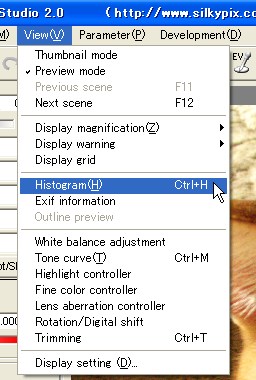 The menu command [View (V)] - [Histogram (H)], "Histogram" dialog will be appeared.
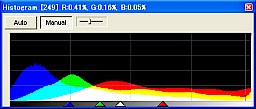 The "Histogram" shows the whereabouts of the brightness distribution curve.
The horizontal axis indicates the brightness (0 - 255). The vertical axis indicates the frequency of each brightness value.
Each RGB is displayed in the graph by each color, and the part that piles up the RGB elements is expressed by the additive color mixing.
6.3.1 Histogram display mode
- The display can be selected from the following two modes.
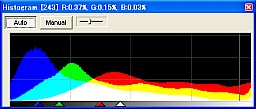 (1) Automatic display
- The scale of the histogram vertical axis is set automatically to the value that appropriate for the image.
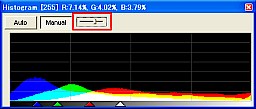 (2) Manual display
- This mode can manually adjust the scale of the histogram's vertical axis.
The scale of the axis can be adjusted by using the below slider. Moving the slider to left will make the scale rougher and moving it to right will make it closer.
- There are four arrows on the grayscale bar, which have the following meanings
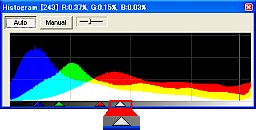 (1) Contrast center
- The white arrow indicates the tone parameter's "Contrast center".
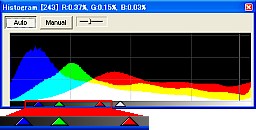 (2) RGB marker
- Pointing to the preview image using the mouse cursor, the RGB value is displayed as the corresponding brightness positioned on the graph. Furthermore, you can indicate the frequency of the brightness of each RGB by clicking on the graph.
- The shortcut keys and the function keys that can be used with this software are as Follows:
* This is a default setting. You can customize shortcut key. Please refer to "9.6 Key customization".
6.4.1 Operation of menu bar
- 6.4.1.1 File
| Open file | Ctrl + O |
| Open folder | Ctrl + F |
| Development | Ctrl + S |
| Ctrl + P |
| Undo | Ctrl + Z |
| Redo | Ctrl + Y |
| Select all scenes | Ctrl + A |
| Copy development parameter | Ctrl + C |
| Paste development parameter | Ctrl + V |
| Initialize development parameter | Ctrl + X |
| Rotate CW +90deg | Ctrl + R |
| Rotate CCW -90deg | Ctrl + E |
6.4.1.4 View
| Previous scene | F11 |
| Next scene | F12 |
| Display grid | Ctrl + G |
| Histogram | Ctrl + H |
| Tone curve | Ctrl + M |
| Trimming | Ctrl + T |
| Copy development parameter | Ctrl + C |
| Paste development parameter | Ctrl + V |
| Initialize development parameter | Ctrl + X |
| Rotate CW +90deg | Ctrl + R |
| Rotate CCW -90deg | Ctrl + E |
| Development | Ctrl + S |
| Help | F1 |
- 6.4.2 Using the context menu
- 6.4.2.1 Display magnification
| Zoom in | Shift + up-arrow |
| Zoom out | Shift + down-arrow |
| 100% | Shift + right-arrow |
| Whole display | Shift + left-arrow |
| Delete mark | F6 |
| Copy/Move mark | F7 |
| Batch development mark | F8 |
| Development | Ctrl + S |
| Previous scene | F11 |
| Next scene | F12 |
- 6.4.3 Shortcut key list
| Key | Operation | Select one | Multi select | Preview mode | except RAW data |
| [F1] | Help | V | V | V | V |
| [F2] | Exposure bias tool | - | - | V | - |
| [F3] | Gray balance tool | - | - | V | - |
| [F5] | Refresh preview | V | - | V | - |
| [F6] | Delete mark | V | V | V | V |
| [F7] | Copy/Move mark | V | V | V | V |
| [F8] | Batch development mark | V | V | V | - |
| [F11] | Previous scene | - | - | V | V |
| [F12] | Next scene | - | - | V | V |
| Ctrl+[A] | Select all scenes | V | V | - | V |
| Ctrl+[C] | Copy development Parameter | V | - | V | - |
| Ctrl+[E] | Rotate CCW -90deg | V | V | V | V |
| Ctrl+[F] | Open folder | V | V | V | V |
| Ctrl+[G] | Display grid | - | - | V | V |
| Ctrl+[H] | Histogram | V | V | V | V |
| Ctrl+[M] | Tone curve | V | V | V | V |
| Ctrl+[O] | Open file | V | V | V | V |
| Ctrl+[P] | V | V | V | V | |
| Ctrl+[R] | Rotate CW 90deg | V | V | V | V |
| Ctrl+[S] | Development | V | - | V | - |
| Ctrl+[T] | Trimming | V | - | V | - |
| Ctrl+[V] | Paste development parameter | V | V | V | - |
| Ctrl+[W] | Switch display mode | V | - | V | V |
| Ctrl+[X] | Initialize development parameter | V | V | V | - |
| Ctrl+[Y] | Redo | V | - | V | - |
| Ctrl+[Z] | Undo | V | - | V | - |
| Ctrl+[0] | Display magnification: Whole display | - | - | V | V |
| Alt+Ctrl+[0] | Display magnification: 100% display | - | - | V | V |
| Ctrl+[+] | Display magnification: Zoom in | - | - | V | V |
| Ctrl+[-] | Display magnification: Zoom out | - | - | V | V |
| Shift+[up-arrow] | Display magnification: Zoom in | - | - | V | V |
| Shift+[down-arrow] | Display magnification Zoom out | - | - | V | V |
| Shift+[right-arrow] | Display magnification: 100% display | - | - | V | V |
| Shift+[left-arrow] | Display magnification: Whole display | - | - | V | V |
| [PageUp] | Scroll up | V | V | V | V |
| [PageDown] | Scroll down | V | V | V | V |
| [Home] | Scroll to the top | V | V | - | V |
| [End] | Scroll to the end | V | V | - | V |